Week 26 of Injection Season saw a similar build to the previous week, further eroding the historical surplus. Today, the EIA reported a net inflow of 49 Bcf, which is just over 10% lower than market predictions of a 56 Bcf build and exactly half that of the 98 Bcf injected this time last year. Much of the West is beginning to see a significant break from the heat heading into October, indicating some relief in power sector demand. This break, though needed to build for a Winter predicted to be upwards of 5 degrees cooler than the last, will still doubtfully result in the 66 Bcf/week pace needed to reach last year’s ending inventory of 3,929 Bcf.
Natural gas storage currently sits at 3,600 Bcf, which is 90 Bcf (2.5%) higher than this time last year and 220 Bcf (6.1%) higher than the five-year average.
The November 2016 NYMEX Future was depressed under $2.96/MMBtu prior to the report’s release, but then quickly jumped to over $3.02/MMBtu.
Outlook for the Balance of Storage Season:
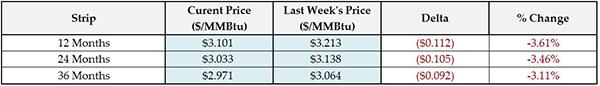
The graph below compares historical 12, 24 and 36 month strip prices and storage levels for the past 5 years.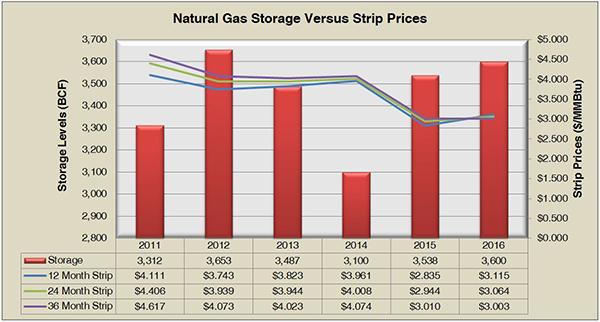
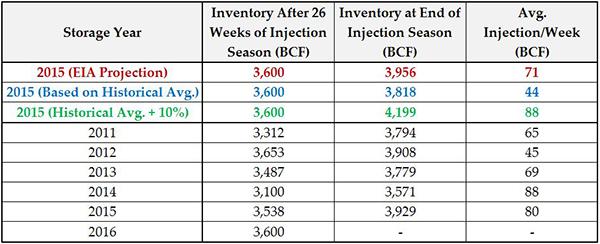
The following table shows the injection numbers we will need to average by week to hit selected historical levels:
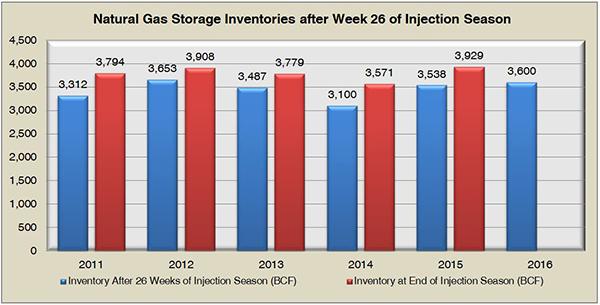
The following two graphs show current natural gas in storage compared to each of the last 5 years and weekly storage averages and patterns.
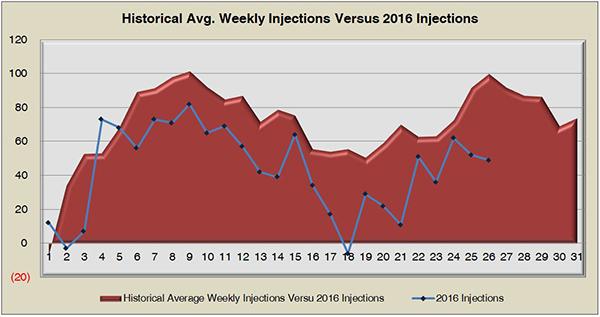
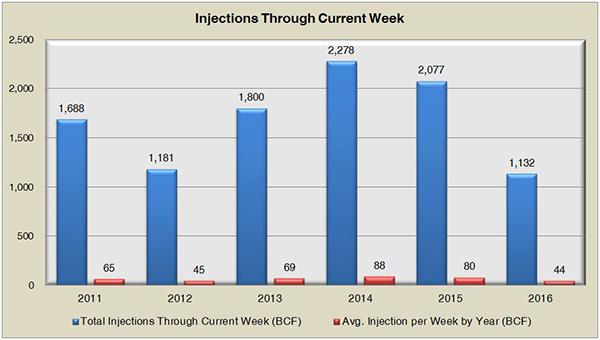
Finally, the graph below shows the injections through the current week over the past 5 years.